Case StudyNextpoint
Designing a legal dashboard that makes AI summaries feel useful, legible, and trustworthy.
Nextpoint needed a cleaner way to surface transcript activity, AI summaries, and recent matters without overwhelming legal teams already working under time pressure.
Overview
A clearer dashboard for legal teams working with transcripts, summaries, and case activity.
The original experience surfaced the right information, but not with enough priority. Users could see metrics, summaries, and recent transcripts, yet still had to stop and decide what mattered first.
My role was to simplify that decision-making: reshape the hierarchy, tighten the interface, and make the AI-assisted parts of the dashboard feel genuinely useful.
What I Did
I started by reviewing the existing dashboard against the product's real use cases: what legal teams came here to check, what they needed to do next, and where the interface forced unnecessary interpretation.
What stood out quickly was that the right information was present, but the page was doing very little to guide attention. Metrics, summaries, recent transcripts, and longer-term activity all lived together without a strong sense of sequence.
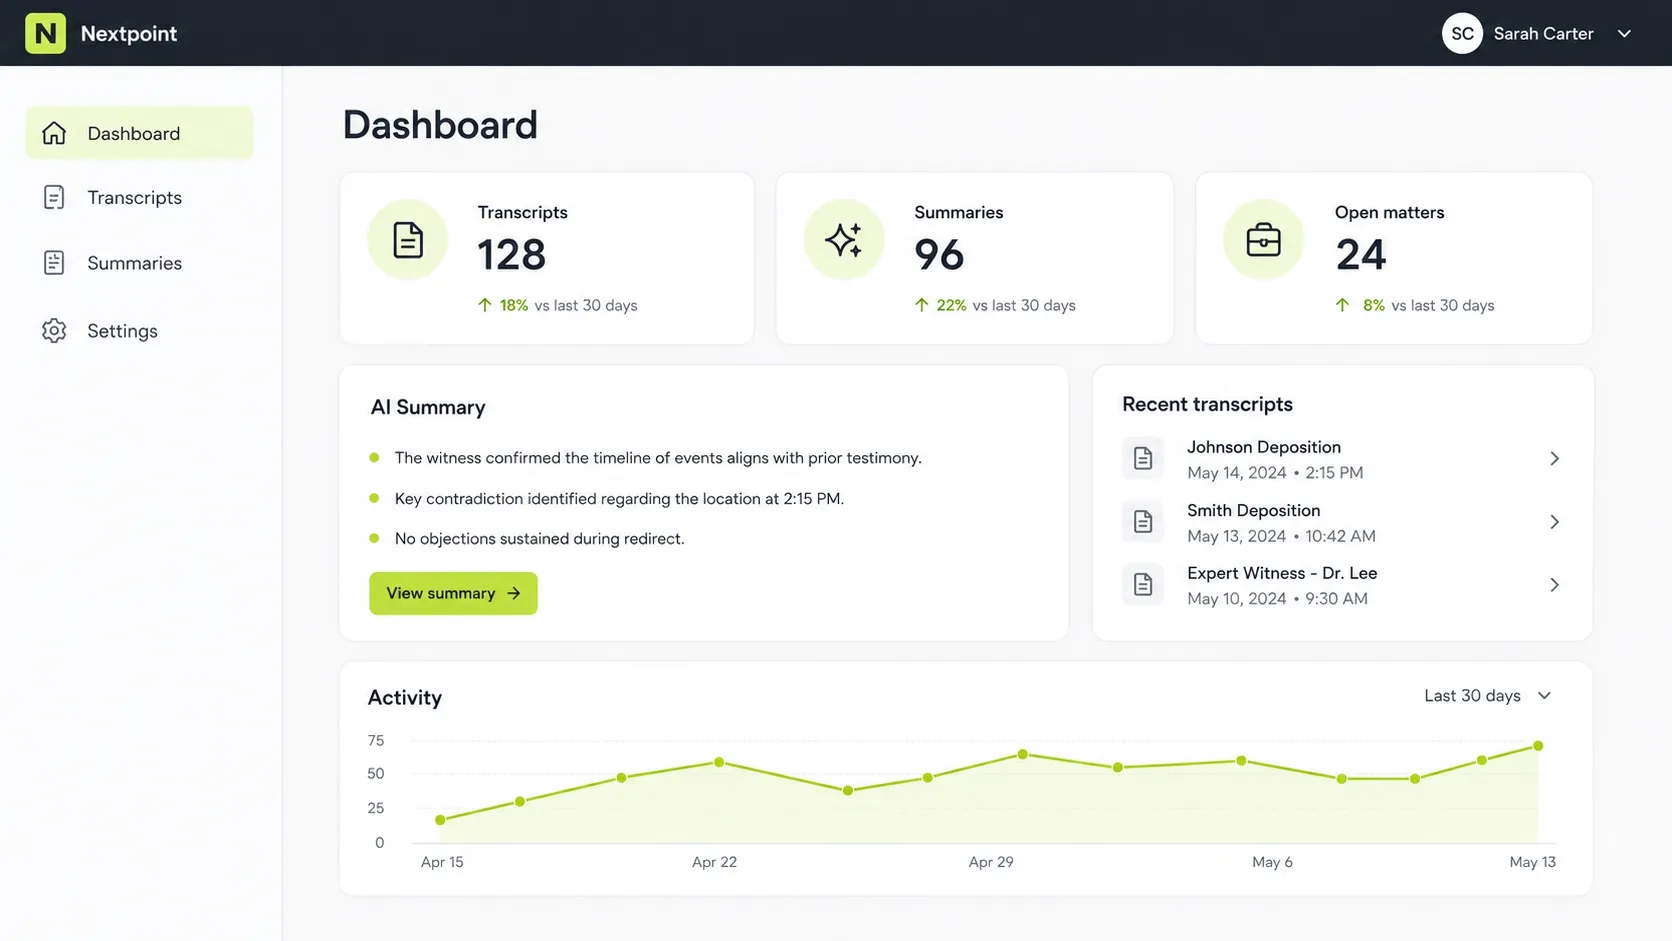
So the redesign focused on order. High-level metrics came first, followed by a more useful AI summary block, then recent transcript activity, and finally the broader activity view. The goal was not to add more. It was to make the existing experience easier to read and easier to trust.
Design Decisions
Legal software becomes visually heavy fast. Once everything looks equally important, users stop getting guidance from the interface and start doing that work themselves.
The main decision here was to make the page feel calmer without making it feel empty. That meant stronger grouping, more breathing room, and clearer contrast between primary actions and supporting information.
I also treated the AI summary as a useful next step rather than just another dashboard module. That shift helped the page feel less like passive reporting and more like active support.
Outcome
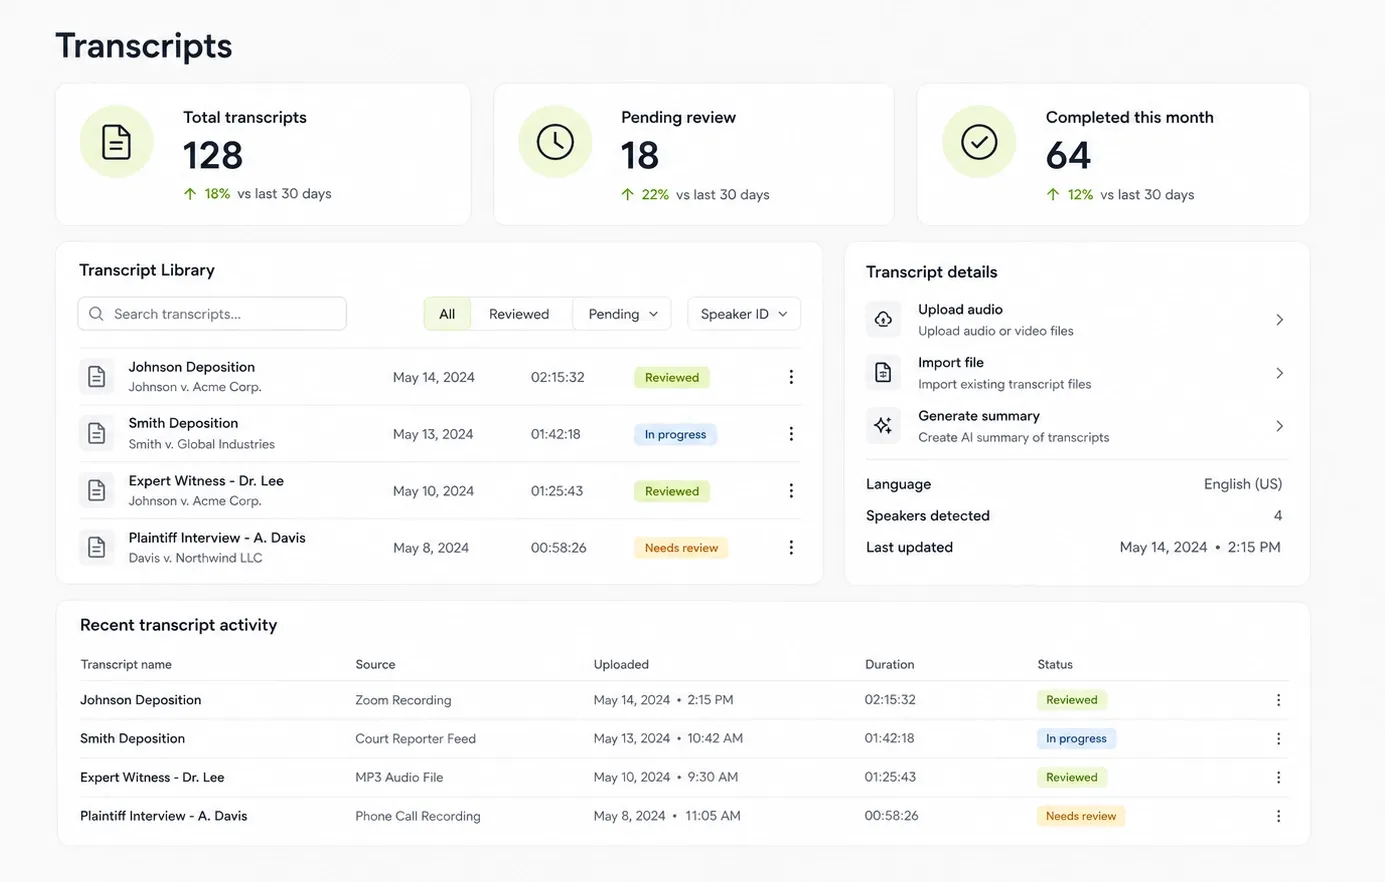
- Clarified the relationship between transcripts, summaries, and open matters.
- Made the dashboard easier to scan by separating signals from supporting detail.
- Shifted the AI summary area from a passive widget into a more actionable next step.
This sample case study is intentionally concise, but the structure is the point: a clear problem, a few grounded design decisions, and a visual outcome that feels tied to the thinking behind it.